My home state is showing up much closer to the top of the list of murder-per-capita than I would have expected, so I went looking for usable stats for gun crimes in Missouri. I wasn’t finding much usable or current info until I came across this… it’s an interactive map that shows locations of shootings all throughout the US, including information on actual locations, details of the type of incident, if people were injured or killed.
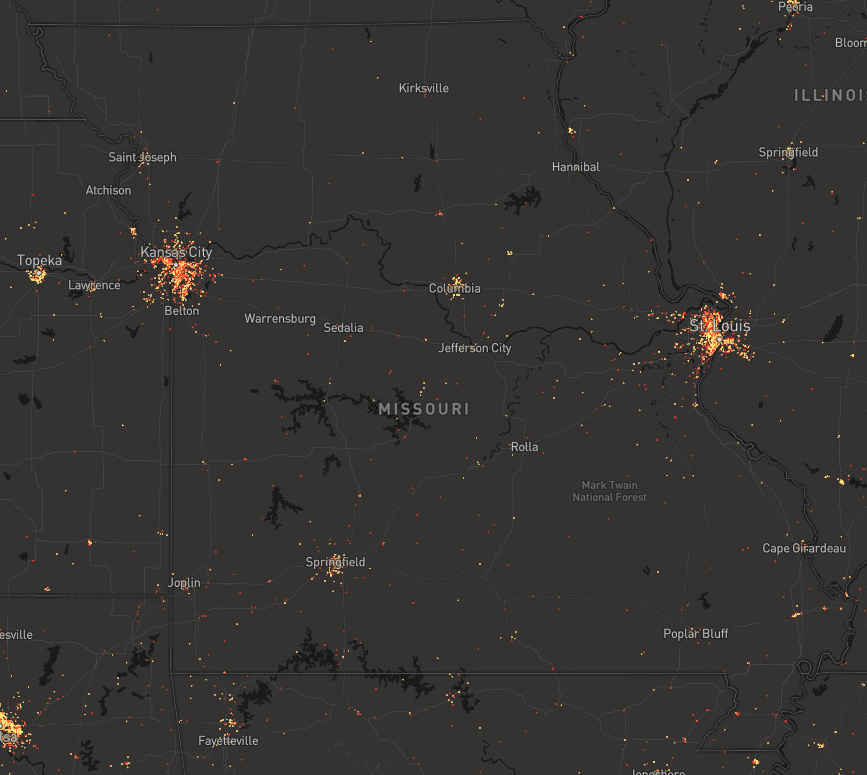
Here’s what Missouri looks like - yellow is an injury, red is a death or death+injury.
Turns out that Missouri doesn’t have a gun-crime problem, Kansas City and St. Louis, and to a much lesser degree Springfield and Columbia, have a gun-crime problem. The entire rest of the state has very low rates of shooting.
At any rate, you can zoom in and see your state, city, down to the individual neighborhoods - worth looking at to see what’s happening in your area.
The question this raises for me is … is the %-per-capita different in the cities vs the country? obviously there’s a lot greater population density in the cities - people-per-square-mile - but does the shootings per head-count percentage go up when the density goes up? the intuitive thought is that it does, but data is a lovely thing.
The second question is if it does, why? is it just the friction of living too close together? the natural personalities of people who seek city living vs. those who seek country living? something else? There’s a ton of speculation about this, and its been studied, but I don’t know that I’ve seen a good data-based answer I trust.
One has to be careful in understanding how the data is used… for instance two towns near us:
Marshfield, which is about 7000 people, has had 3 shootings with one of them in the last year.
Lebanon, at 14,000 people, had its first shooting last year.
Nevertheless, Lebanon recently made the top 10 list of citiesnation-widethat are getting more dangerous. Because of an increase of one shooting.
So… going from 0 to 1 shootings is a big deal, percentage wise, but not so much in terms of actual danger. I’m guessing that an AWFUL LOT of cities have increased by more than 1 shooting… and they didn’t make the national top-10 list.
There’s lies, damn lies, and then there’s statistics.
My observation on shootings isn’t population size, most big cities are liberal and have huge areas of poverty or low income housing, and theres not a lot of respect for others property or life. It’s dog eat dog.
You get out in the country where your neighbor is gonna be able to help quicker than any 911 response and you immediately have common ground with your neighbors. Everyone looks out for everyone else. It’s a completely different mindset.
Why is there even such a thing as a “Gun Violence Interactive Map”? Shouldn’t it just be a violent crimes interactive map? Unless there is a Left leaning agenda driving it. I hear so much about gun violence these days. What about hammer violence, 2x4 violence, etc…? Why all the focus just on gun violence exclusively?
Good point, @_Robert. Why not an interactive map where you can sort by weapon used? That would open a lot of eyes.
It’s unfortunate that this conversation even has to take place. It hurts my heart to know that my children were and granddaughter is being raised in such a hate-filled world. That’s just one of the reason this Community means so much to me. You all remind me on a daily basis that no matter what the media reports, there are still genuine, caring, ethical people in this world who want to help others simply to help them. Thank you for being you!
@_Robert I agree, on general principles about the weapon prejudice, but on the other hand, there is so much bad data, or cherry picking of data, or hair-on-fire presentation of data that having a way to go cross reference is really useful. Seeing my local town of Lebanon listed as one of the top 10 most increasingly dangerous cities in the country is alarming. Being able to see that it’s because they went from 0 shootings to 1 shooting puts a very different interpretation on it.
@Zee I am a data guy. Being a process improvement, subject matter expert in my industry (when I had an industry), I have had to work very hard to shift the culture to look at root causes and not so much at the more surface-like direct causes for our issues. My industry has lived and died by performance metrics and they do not tell the whole story. Here is one way that I have seen the anti’s couch gun violence. Look at all the youth crime for example. Youth means what you define it to mean. Up to 18 years old? Maybe it’s 21? Are these youth inner-city gangsters? What are your control groups, etc? I know full well how data can tell any story that you want it to. I am simply saying that the term Gun Violence is a huge manipulation in and of itself! What about all the other types of violence? Are they somehow less consequential? If a person is deliberately run over by a car is that somehow an easier death for the victims family to come to terms with? Nope. It is still a violent crime. The issue with “Gun Violence” statistics is they lump selective categories together to make the data sing their song, and to their melody. There is an author, John Lott who has written a lot of books on the topic. Check him out, he is an unbiased expert on crime and our society.
Love John Lott, I’ve read all his books.
This map isn’t intended to be the end-all of gun violence statistics, but it does look like it provides a specific window into shootings, both fatal and non fatal, as well as provide some essential data to understand the context. Things like who got shot (victim? Suspect?) and what the context was (domestic relationship? Ex relationship? Robbery? Police involved?)
It’s a very complicated solution but would be very effective.
Treat people how you want to be treated, and treat criminals like criminals and quit making excuses for them. At a certain point in someone’s life they made a conscious decision on what road they were going to travel.
Thanks for sharing this, @Zee! My first thought was the same as @_Robert, wondering what the motivation was behind it and who was using the information. Just to show the lit-up map to an anti-gun person would be justification of their position in their eyes, without really thinking about per capita numbers or motivations, etc. I’d be interested to know how many of these were self-defense, accidental, or illegal ownership/use. What percentage of offensive shootings are really committed by concealed carry permit holders. My son-in-law’s cousin and a girlfriend were one of the dots, caused by an accidental .45 hollow point discharge into his leg. Poor handling and judgment. It’s still a very interesting interactive map!
According to this web site there have been 2 shooting in our area since 2014. Local LE say thugs don’t do home invasions here because 98% of people are armed and will shoot them. Mountain people live by mountain law.
I know there are more than that, maybe they got buried instead of getting reported. There a lot of back hoes in the area.
I imagine the the “defensive use” category use is lower than it actually should be, because many times, “defensive use” of a firearm may not be apparent until much later. I wonder if these folks update that data when that is determined. I kind of doubt it, because I imagine many media organizations won’t publicize that.